PACK-IT SOLUTIONS
![]()
|
PACK-IT SOLUTIONS
|
|
TQM 673 projects:
|
KAMIL DZWONKOWSKI ELeARNING ID: IE 673-Fall 2008-70-38 Pack-It-Solutions Collaborating with:
Table of Contents: Introduction and Project Objective Methodologies Applied The main body of the project Statistical Quality Control Applied Summary
Introduction and Project Objective: The main character of this project is to apply Total Quality Management strategies, focused around the control chart modeling for a number of different variables and attributes and their convention to better a process and its quality. There is a verity of methods, and a number of solutions to develop any method. One of these types of methods is represented statistically, however this is not the only strategy available that will result in a process improvement.
Methodologies applied: The quality tools that we focus on are called statistical Process Control Charts. There are used for variation controlling, and obtaining a process associated data with inputs/outputs. It becomes very importuned fo the predicted changes in the future to better the processing system. It’s used as an additional tool to back up the quality factors introduced as CORA analysis. The data measurements required for a Process Control Charts are collected thru measurements from a verity of sensors and A/D meters. When the data is collected, it is transformed into frequency distribution algorithms. Such frequency distribution is described as a number of times when a particular quality characteristic occurs within it sample of the products to be tested. It is significant to understand, that the testing of a progression, including the collected data involves comparing it with a set of defined specifications sheets. This is also called as Key Characteristics. The statistical process control charts make it easier to identify bad processes and design upstream production techniques, therefore resulting in continues process control and seamless production.
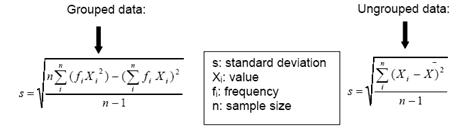
The Main Body of the project: Control charts deal with characteristics that can be measured and assigned a numerical value. These values are plugged into equations that the control charts uses. Below is a list of mathematical data or formula used in control charts. · Xi: value -The actual value of each measurement. · fi: frequency -The frequency of each measurement - The number of times each measurement occurs in the sample. · n: sample size - The sample size - the number of products measured or investigated. · ∑: Sigma - the sum of all values taken. · X bar -The average of a sample - is the sum of all values divided by the sample size. (formula given below) · R - Range - the difference between the highest and the smallest value encountered in the sample. · S - Standard Deviation - The standard deviation measures the variability in a sample data set. The higher the standard deviation, the larger the scatter about the average is.
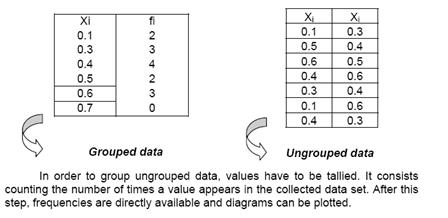
There are two different types of data that can be used in control charts. Grouped and ungrouped data Grouped data: In this case, data is classified by increasing order (Xi) and frequencies (fi) of occurrence next to their values. Ungrouped data: Data (Xi) is gathered in a bunch of values, without any classification. The table on the left represents ungrouped data as can be seen by the random values for X. The table on the right is that of grouped data as can be seen by the increasing values of X and by the frequency column.
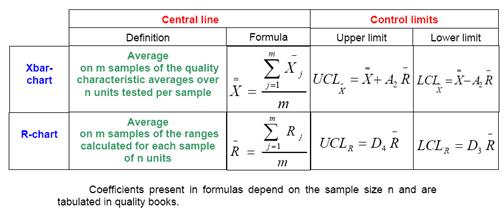
Many different types of control charts are available for use. Some control charts and their respective uses are listed below. For the context of this assignment however, we will be using X -Bar and R type control charts.
Formulas for X-Bar and R-Charts are given below. The coefficients A2, D3, and D4 in the formula below depend on the sample size and are usually found in mass media.
Steps in Constructing an R Chart: 1. Select k successive subgroups where k is at least 20, in which there are n measurements in each subgroup. Typically n is between 1 and 9. 3, 4, or 5 measurements per subgroup is quite common. 2. Find the range of each subgroup R(i) where R(i)=biggest value - smallest value for each subgroup i. 3. Find the centerline for the R chart, denoted by
4. Find the UCL and LCL with the following formulas: UCL= D(4)RBAR and LCL=D(3)RBAR
Statistical Quality Control Applied: After collecting the required data and plotting it into the control charts, we output analysis that will oversee the future of our processing line. The first step is deriving the coefficients A2, D4 and D3. We simply fallow the table form the specification sheet.
Therefore:
We apply the collected data to construct the Control Chart:
Next we plotting the subgroup data and assuring that the process is in statistical control. In a case that the test is not successful, we need to eliminate the cause and repeat the testing procedure.
We never eliminate subgroups that have points out of the range. Next step is the application of standard deviation that could be executed by applying the following formula:
Therefore we conclude that:
While we have identified the R-BAR, we need to find also the X-BAR. As noted from the methodologies applied, we used the following formulas:
While we assume A(2) to be at 1.023, we result the following findings after plotting in to a X-chart:
Therefore we conclude that:
Summary: 1. The Control charts are excellent tool to determine mistake processes, and deriving an upstream process control, which results in continuous monitoring of the system. 2. While there might exist an out-of-control action, it has to be immediately corrected. 3. As the system is capable of self-correction, if it undergoes a malfunction, it has to be reconfigured by the administrator. 4. As a result of sub-processes, an out-of-limit variation might be produced. These variations have a very strong effect on the quality of the product and seamless production line. When the statistical methodologies of PCC are applied, this variation can be easily identified and eliminated. 5. A greater costumer satisfaction, lower waste of production, and highest possible quality could be achieved when implementing process control charts in a particular process. 6. While the highest satisfaction of the costumer is important, the lowest waste assures being environmental friendly, and continuously GREEN.
References and Bibliography "Paul G. Ranky, IE673 Total Quality Management, Fall 2008, e-Learning Pack ID # IE673-FALL2008-70-38" "Paul G. Ranky"
Ranky, P.G.: http://www.cimwareukandusa.com
| ||||||||||||||||||||||||||||||||||||||||||||||||||||||||||||||||||||||||||||||||||||||||||||||||||||||||||||||||||||||||||||||||||||||||||||||||||||||||||||||||||||||||||||||||||||||||||||||||||||||||||||||||||||||||||||||||||||||||||||||||||||||||||||||||||||||||||||||||||||||||||||||||||||||||||||||||||||||||||||||||||||||||||||||||||||||||||||||||||||||||||||||||||||||||||||||||||||||||||||||||||
|
Send mail to
kd52@njit.edu with
questions or comments about this web site.
|