PACK-IT SOLUTIONS
![]()
|
PACK-IT SOLUTIONS
|
|
TQM 673 projects:
|
KAMIL DZWONKOWSKI ELeARNING ID: IE 673-Fall 2008-70-38 Pack-It-Solutions Collaborating with:
1. Introduction and Project Objective Total Quality Management strategies used at Pack-it-Solutions is dedicated to the subject of best quality. For us, quality means future outcome. We are dedicated, as well for continues satisfaction of customer requirements at lowest cost by harnessing the efforts of everybody in the company. We use high quality materials, and perform statistical analysis to minimize the waists. We always focus on GREEN FRIENDLY processes. As awkward it may seem like, we are toxically challenged but always ECO-FRIENDLY. Our engineers follow these definitions: Ø Quality assurance means sustaining a system which prevents defects. This includes quality control and quality engineering. Ø Quality control means establishing and maintaining specified quality standards of products. Ø Quality engineering is the establishment and execution of tests to measure product quality and adherence to acceptance criteria. And it is not a coincidence, because we define quality as the overall level of product /process / service excellence. Our goal in the industry is to be the most reliable Chemical Packaging and Process institution in the world. To accomplish this, the company must continually adapt changing technologies that are shaping future, and must understand how to work with these revolutionary technologies to their advantage.
2. Description of the Methodologies Applied Based on the latest ISO interpretation, we will introduce the eight quality management principles upon which the quality management system standards of the revised ISO 9000:2000 series are based. The principles are derived from the collective experience and knowledge of the international academic, industrial, management, and research experts who participate in the ISO Technical Committee ISO/TC 176, entitled: Quality Management and Quality Assurance, which is responsible for developing and maintaining the ISO 9000 standards for all of us. These principles can be used by senior management as a framework to guide their organizations towards improved quality performance. The spirit and the terminology, that the eight quality management principles define in the ISO 9000:2000 documents, entitled Quality Management Systems Fundamentals and Vocabulary, and in ISO 9004:2000, Quality Management Systems Guidelines for Performance Improvements. The eight ISO 9000:2000 Standards are listed below: Principle 1: Customer Focus: Organizations depend on their customers, and therefore should understand their current and future needs, as well as should meet customer requirements, and strive to exceed customer expectations. Principle 2: Leadership: Leaders establish unity of purpose and direction of the organization. They should create and maintain the internal environment in which people can become fully involved in achieving the organization's objectives Principle 3: Involvement of People: People at all levels are the essence of an organization and their full involvement enables their abilities to be used for the organization's benefit. Principle 4: Process Approach: A desired result is achieved more efficiently when activities and related resources are managed as a process. Principle 5: Systems Approach to Management: Identifying, understanding and managing interrelated processes as a system contributes to the organization's effectiveness and efficiency in achieving its objectives. Principle 6: Continual Improvement: The continual improvement of the organization's overall performance should be a permanent objective of the organization. Principle 7: Factual Approach to Decision: Effective decisions are based on the analysis of data and information. Principle 8: Mutually Beneficial Supplier Relationships: Even if an organization and its suppliers are interdependent, a mutually beneficial relationship enhances their ability to create value.
3. The Main Body of the project The project had begun with co-meeting the cooperative team management members from our host companies:
Ø
Noax
Technologies
Ø
GE
Healthcare
Ø
Rockwell Automation Ø BioPharma Solutions Stepladder that we are taking, in older to fulfill the TQM model specified in the “Description of the Methodologies applied” section below; ISO TQM Standard Principle 1 - Customer Focus Pack-It-Solutions, in order to satisfy the Customer Focus principle does provide the customers with a high quality product and with higher level of customer satisfaction. These are the details of the procedure: The strategy that we are going to apply in this particular assignment is known as CORA analysis. It was originally derived by Prof. Paul Ranky, Ph.D in order to seamless process TQM requirements. The analysis of “component oriented requirements analysis” is founded on Quality Function Deployment – QFD and also a number of other strategies to satisfy the needs of costumers. The other future includes the method of TOPS – Team Oriented Problem Solving, which was CORA engineered from. This assures minimal, potential costumer dissatisfaction, loss of labor force, poor materials, and week communication. Component Oriented Requirements Analysis enables the design team to produce the most efficient product, with the highest quality, that will surely satisfy the biggest expectations of its costumers. During the plant operation, CORA is applied on all the levels. Before we even start to design the product, as well as of its end, when we distribute and sell to our clients. This scheme assures a constant best quality, and gives opportunity for improvement. The CORA team’s goals are to:
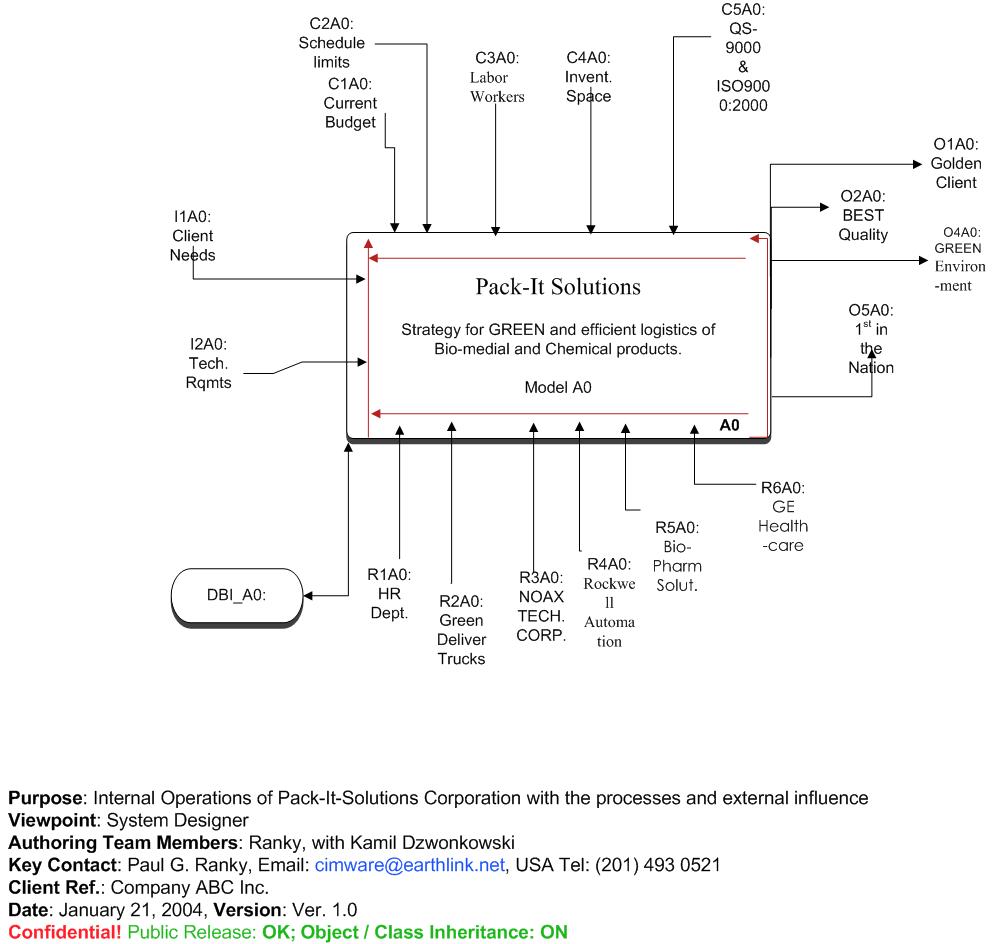
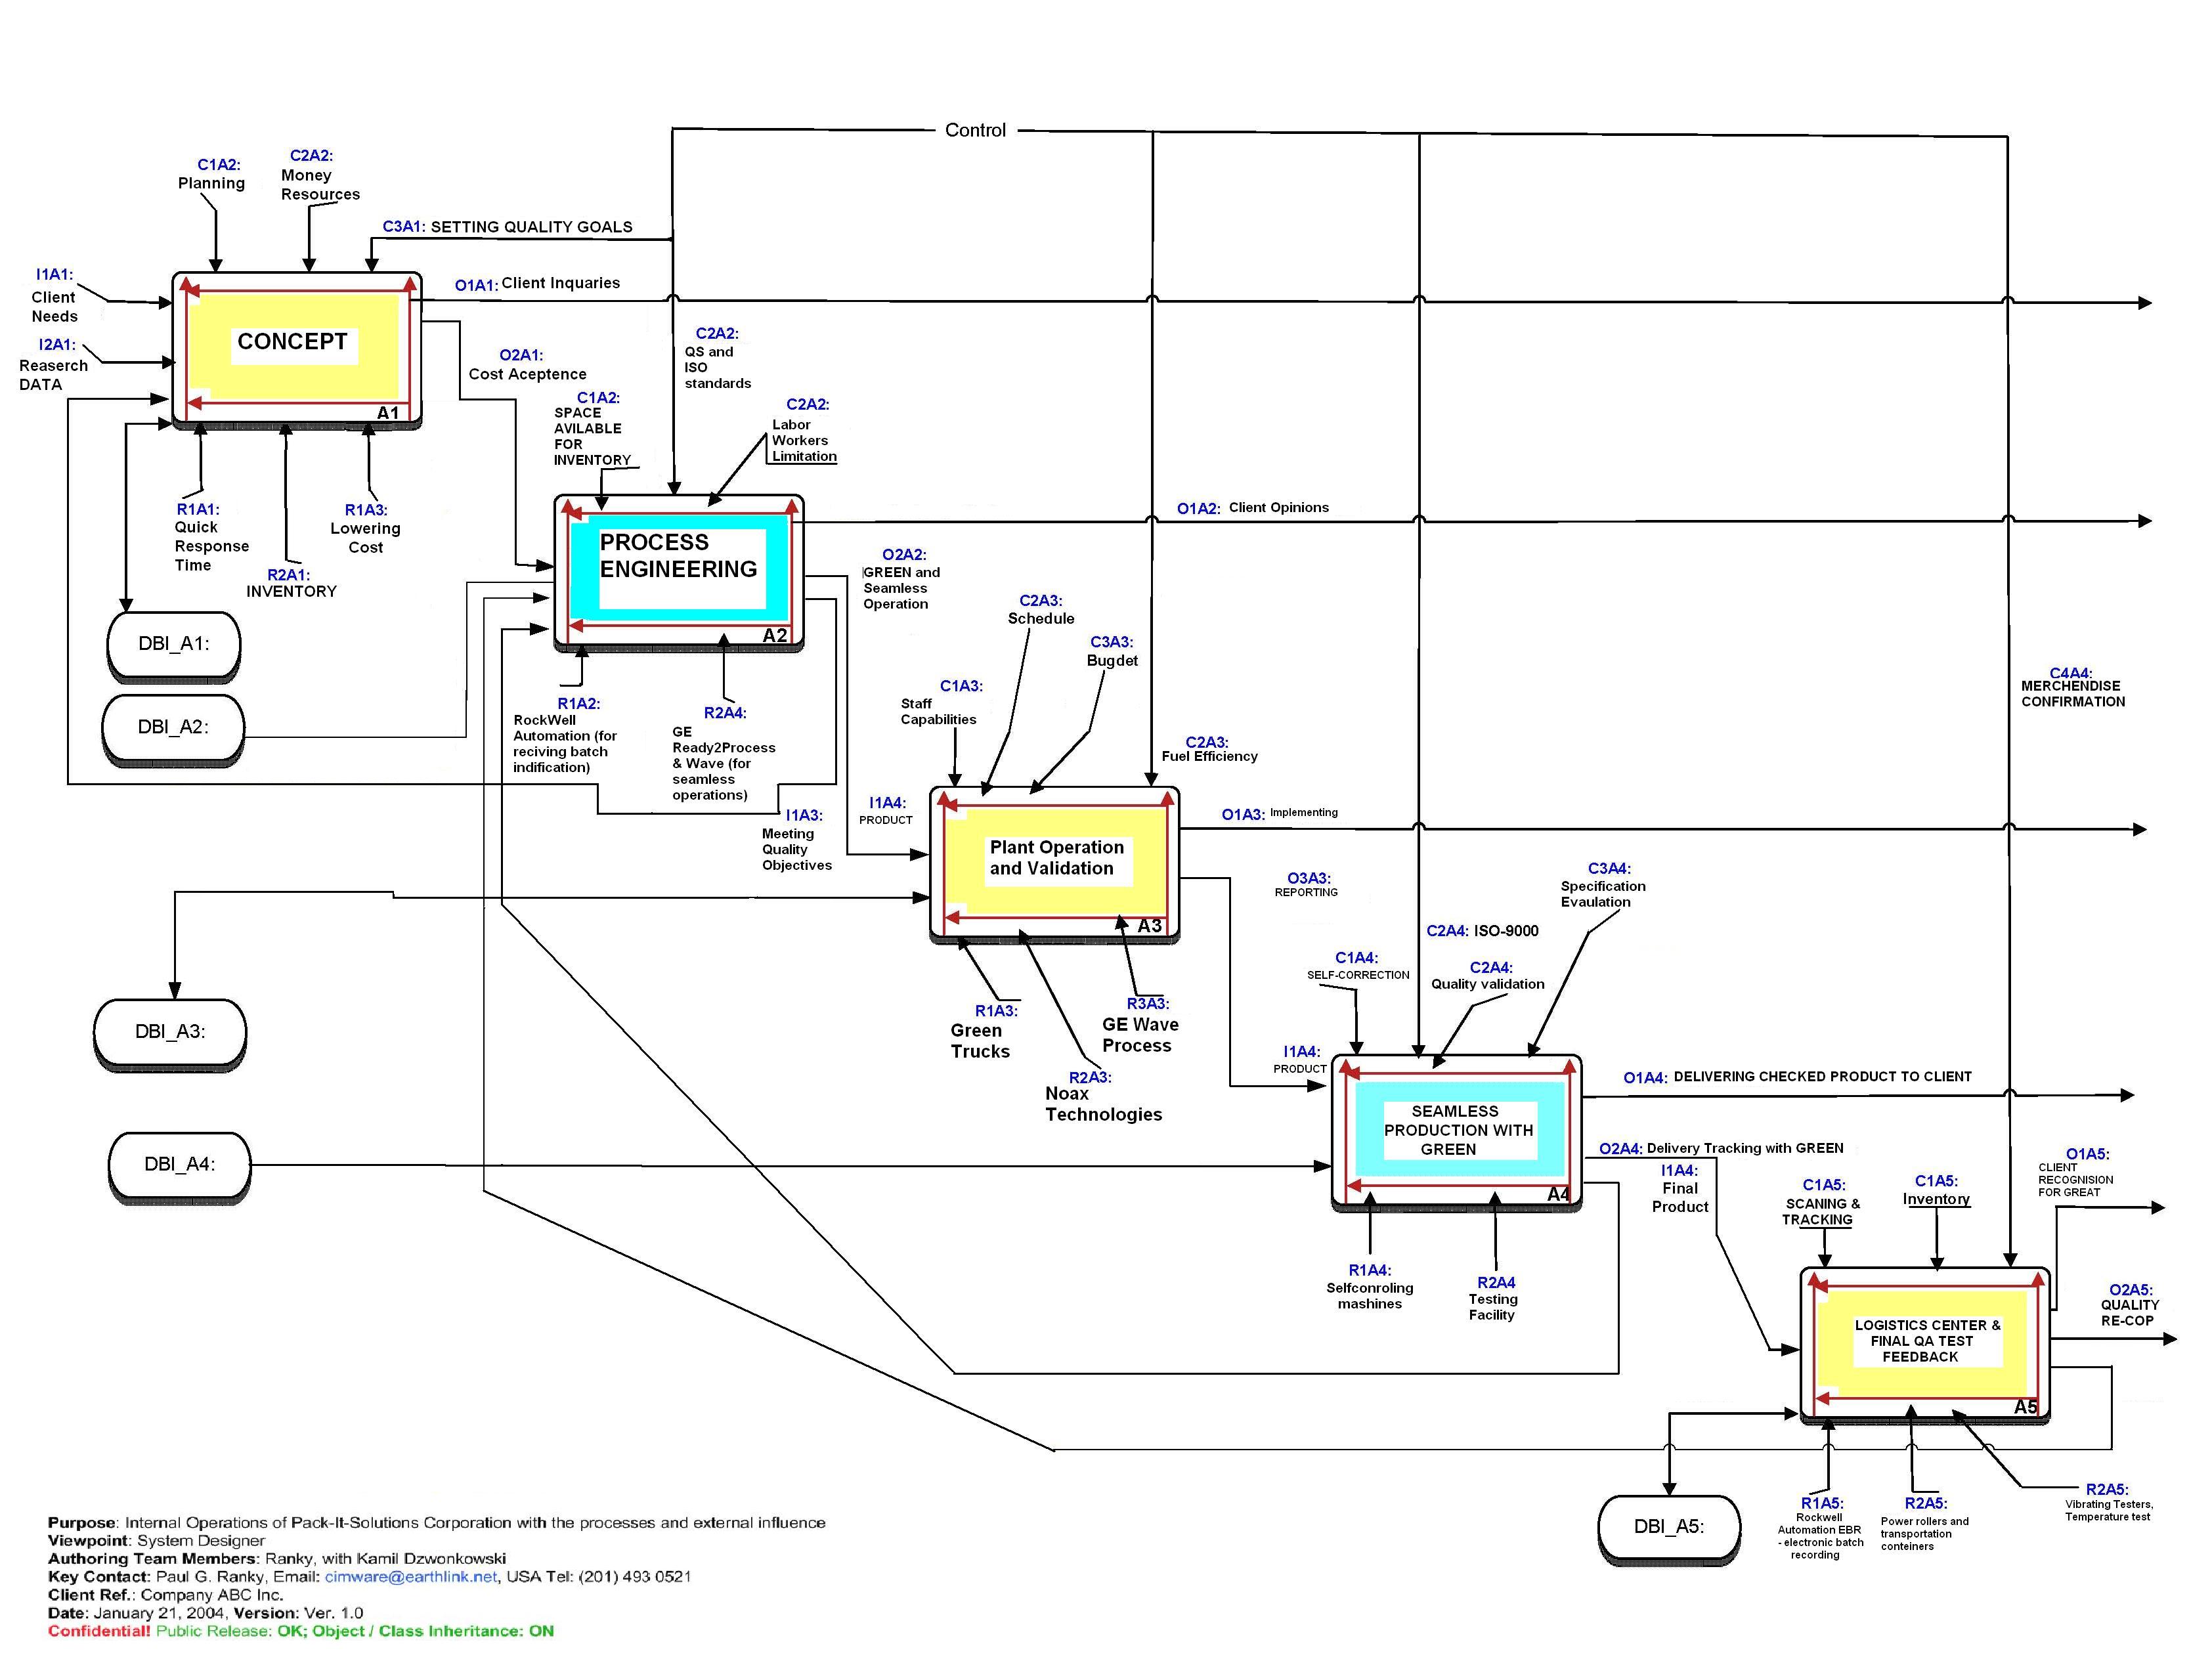
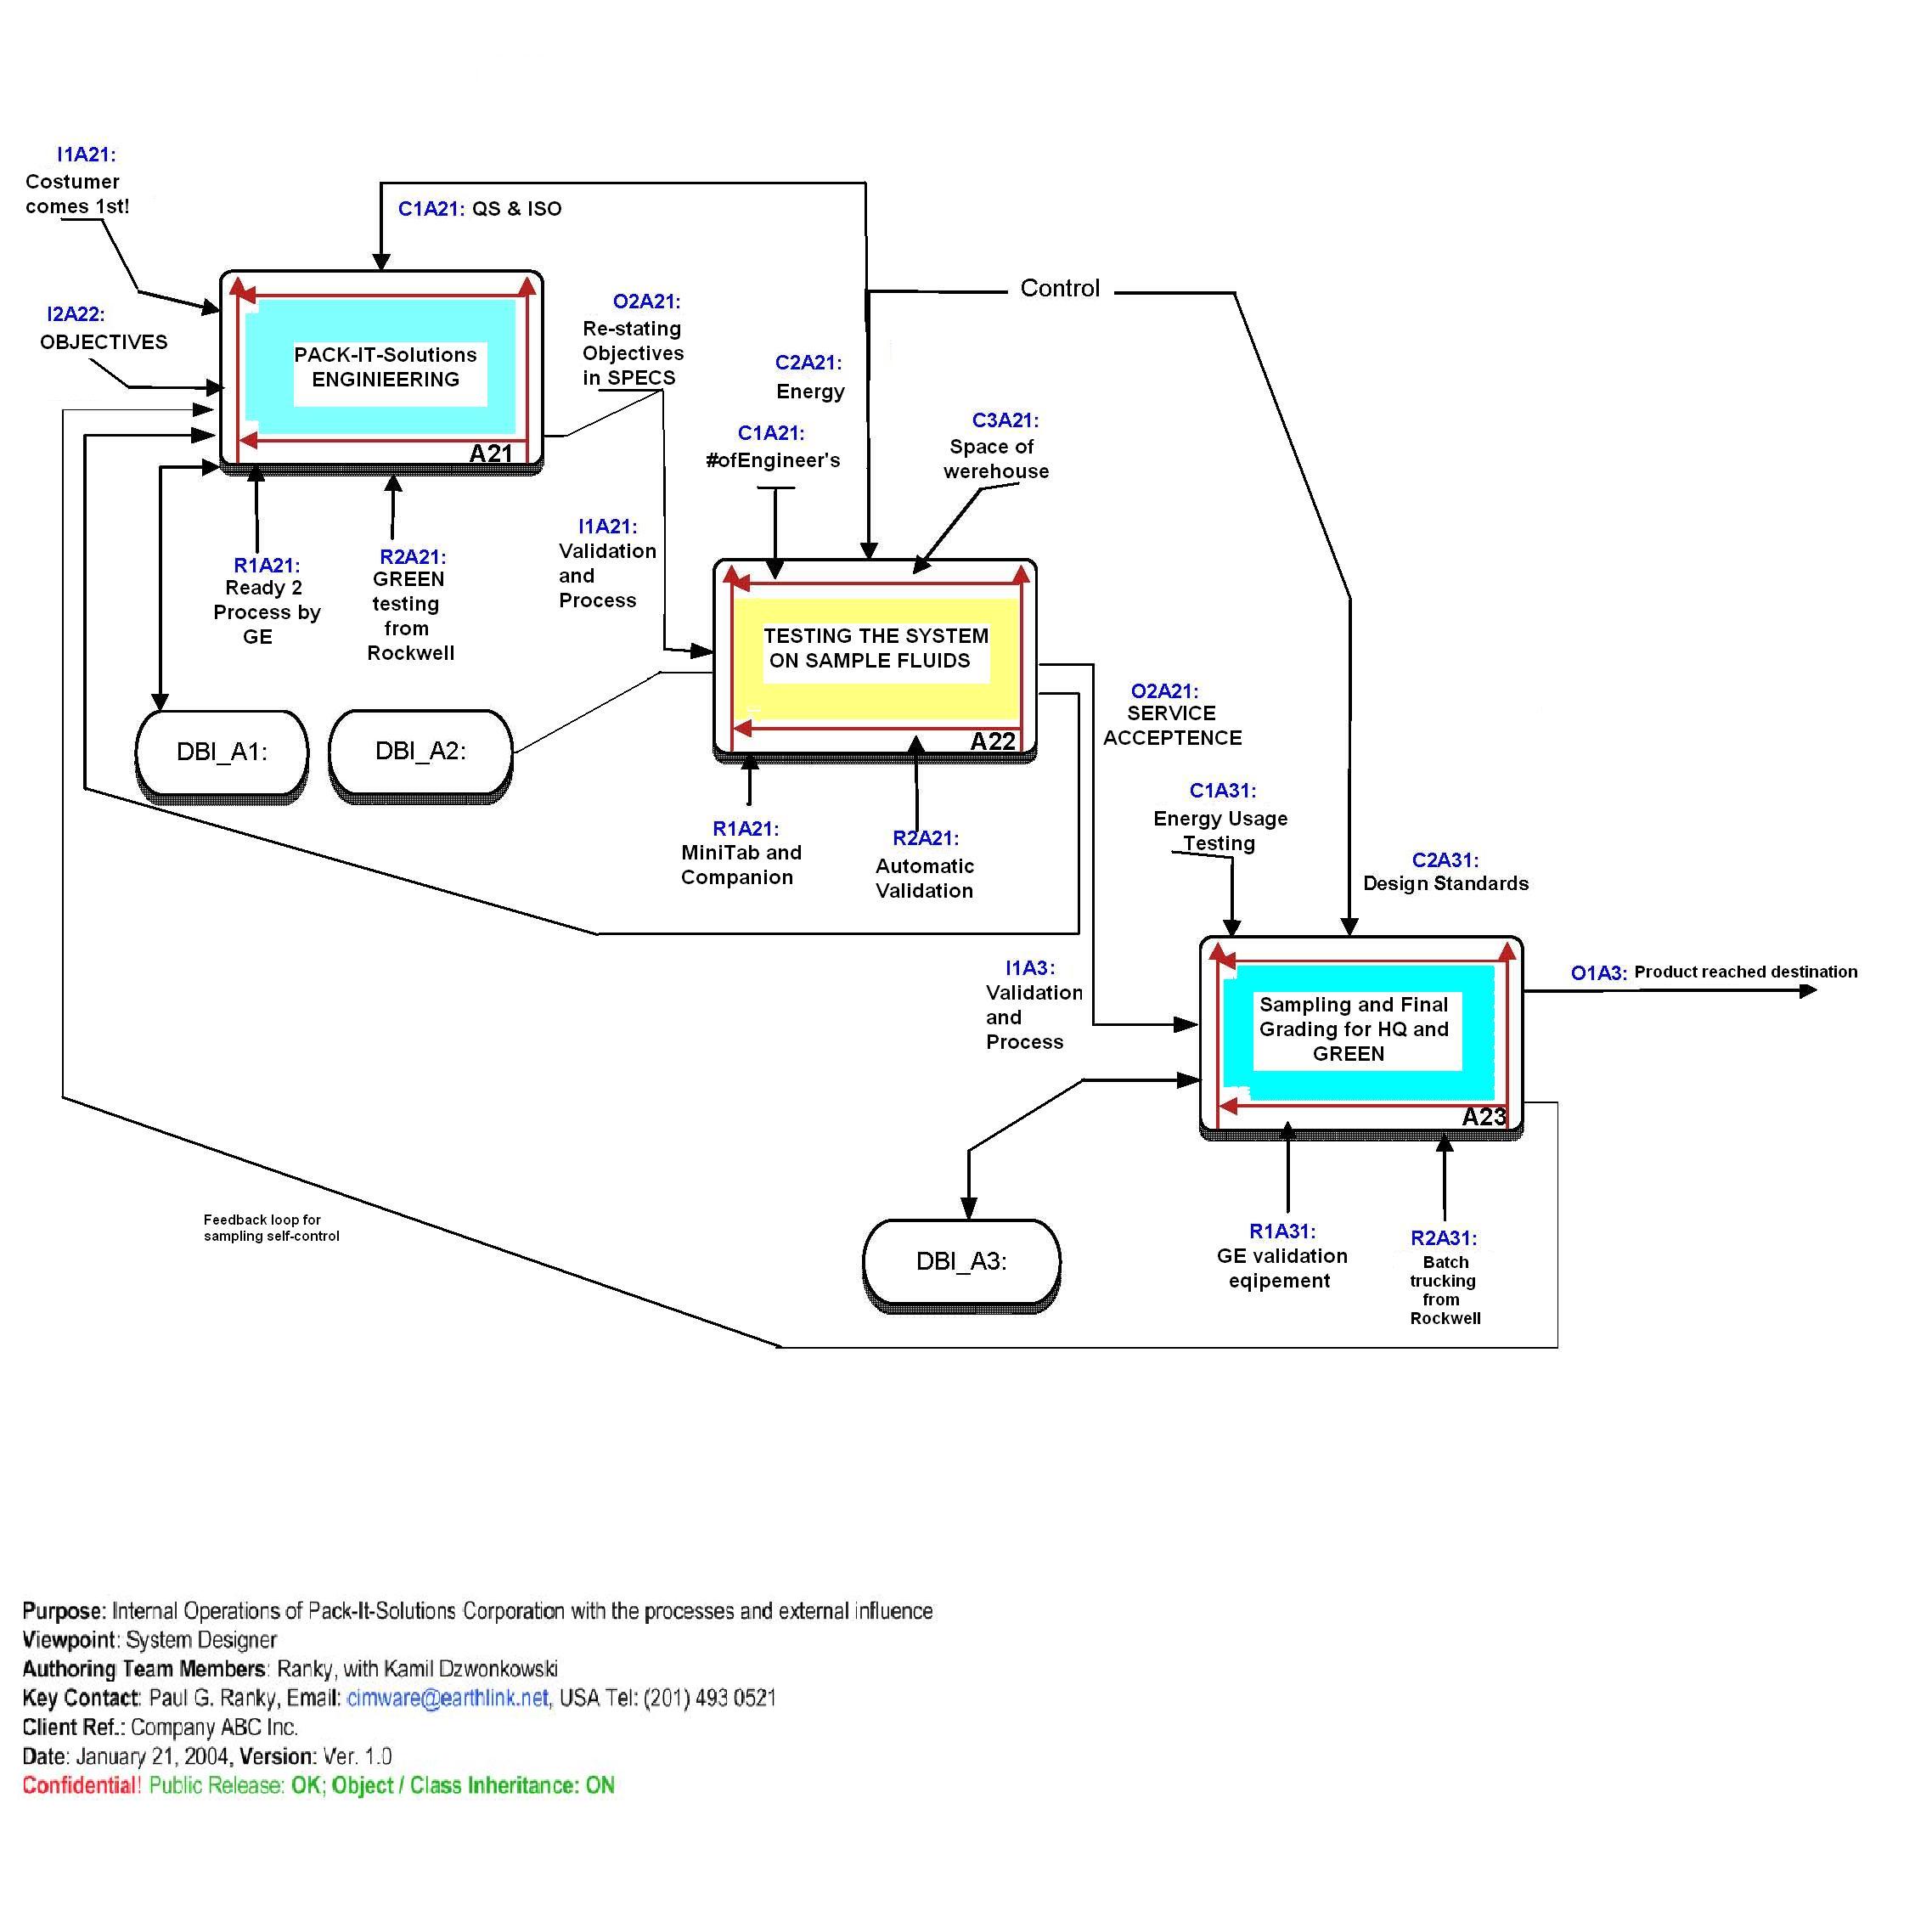
The CORA matrix is integrated in four modules: User requirements Design Engineering solutions Provide a parameter calculation Set a point of reference, a scale (Benchmarking) CORA asks for correlation levels of Low (1), Medium (3), or High (9). Those are the fixed numerical values assigning their level of importance. Those numbers are programmed to calculate relevant scores of the importance of the requirements. The importance ratings are the scores that are calculated to baseline and compare values relating to the final product. Correlation rating values are usually between 1 and 5, 1 being the lowest. In addition, CORA considers competitors ratings in each “customer requirement” area in order to illustrate performance. First of all, we conducted a meeting of the CORA PACK-IT-SOLUTIONS members. The team was chosen along all the collaborating companies: The equipment used - in our storage a facility is interconnected with Noax Technologies industrial grade PCs. They are mounted on-board each of our fork-lifts, and constantly monitor the in-stock storage inventory. When an order is received at a truck gate, the system automatically informs the nearby fork-lift operator to deliver the shipment to a designated destination. This enables constant in-stock quantity assurance, and a short delivery turn-around time. Rockwell AutomationØ is providing our storage facilities with a number of their services, with the focus on the Electronic batch recording (EBR) and Radio frequency identification (RFID)-enabled solutions. These services provide as with a constant control of where a package is currently being handled and assurance the proper quality monitoring. Bio-Pharma SolutionsØ will implement their Baxter highly sophisticated temperature control for proper temperature, pressure and moisture setting requirements. The specially designed environment for the chemical and pharmaceutical products will insure proper conditions to keep it healthy and stain free. Our fourth partnerØ is the GE Healthcare solutions know by the name of ReadyToProcess and Wave. General Electric has integrated our packaging/valediction process in a very quince way. It was developed for seamless operations, and it consists of a series of stainless equipment to design, validate, cut cardboard, fill bottles, and melt Styrofoam. The system is intergraded with the disposables and waste equipment. The biopharmaceutical mixers, tube welders and sealers allow users to configure facilities using disposables exclusively. To model the CORA analysis we have used a CORA template developed by Prof. Ranky. Please click on the link to see the analysis and the results. Prior to making the analysis, the CORA team collected costumer requirements, and different opinions. We used such methods like public surveys, phone interviews, statistical data, published scholar journals, researched data and our team experience. This had assured a legitimate data, which could be trusted. In our CORA model we used such inputs like: Reliability of the delivery service, Package Environmentally Focused, Delivery time, Storage issue, Quantity of material used, Weight of package, Seamless validation, Quantity delivered, Helpful service. These were the most important requirements that we have identified. The CORA Team will rank customers wants, needs, desires, and requirements, and the purpose of this activity, is to put all customer requirements into a priority order. CORA refers to this as 'Importance Rating'. IR values range from 1 to 5, 5 being the most important. We have recognized that Seamless production is our most important factor, and is the biggest influence on costumer recognition. The other two factors that were equally important were a better costumer service and high delivery capabilities. It is to as no surprise, as we expected the high delivery requirements to be such an important factor; however we didn’t recognize at first that the costumer service will have such a huge influence on our business. ISO TQM Standard Principle 2 - Leadership Leaders establish unity of purpose and direction of the organization. They should create and maintain the internal environment in which people can become fully involved in achieving the organization's objectives. Each of our employees has: · An outlook for the organization's future, · A understanding of challenging goals and targets, · Values that are created and sustained · Trust and knowledge that fear can be eliminated, · Resources, training and freedom to act at a clearly established level of responsibility and accountability, · Inspiration, which is encouraged and will be reworded. ISO TQM Standard Principle 3 - Involvement of People The following are the most important characteristics fallowed by our workers: · Employees will understand the importance of their contribution and their roles in the organization. · Employees will accept the ownership of problems and it should be their responsibility to solve them. · Employees will be actively seeking opportunities to enhance their competence, knowledge and experience levels. · Employees will freely share knowledge and experience. · Employees will openly discuss problems and issues with each other. ISO TQM Standard Principle 4 - Process Approach CIMpgr methodology refines the way we look at processes, in that it separates inputs, outputs, controls and resources, as well as offers layering for complex projects. These are the details of the procedure: The Top layer(Layer0) diagram illustrates the basic, top layer CIMpgr object with the attributes of the object, grouped into Inputs, Outputs, Controls and Resources (I, O, C, R). It is a high level of the overall process and the company. This layer is commonly termed as the ‘parent’ layer. The Second layer (Layer1) diagram typically explains more about the main processes within the top layer .It represents a deeper prospective into these individual processes and how they affect the overall view. This layer is also commonly termed as the ‘child’ as it originates from the parent or the top layer. The Third layer (Layer2) diagram is a more distinct view to a main act. A1- Concept - Planning and Research Brainstorming and overseeing different opportunities, perspectives and ideas are the core objectives of this stage. The main inputs for our strategy of the service to be developed are the needs of our customers. We derived this conclusion on a previous research performed by the HR department of Pack-It Solutions facility. The second input that our company is concerned with is the requirement of a professional delivery, processing and storage of chemicals request from the public. Thru cooperating with a number of sophisticated processing techniques from different corporations, we are delivering a state of the art bio-chemical processing facility for the most desirable client. The major aspect of output in the case of Pack-It-Solutions is the absolutely highest possible quality, seamless processing of chemically challenged products, and delivery to a nationally wide location with a special focus into environmental friendly GREEN attitude. Tools such CORA, along with ABC costing and Risk analysis, enable us to achieve these goals. A2 – Process Engineering - Design, Engineering and Validation This is the second phase into Process Excellence, and it is concerned with more in-depth view of the entire processing aspect of Pack-It-Solutions. The core inputs are the values of project planning and research, with the resources of being concentrated in high quality with the lowest output cost. Time is also a factor, since its balances the revenue return. Phase II is represented as a detailed diagram of linked system of analysis. It consists of 2D and 3D computer modeling. It enables a Process Engineer to recognize weakest points and potential innovative way for improvement. The resultant of stage II process analysis is a perfect chemical processing service, which provides seamless operation, highest quality product in a GREEN environment. To insure excellent end-user quality the system is equipped with two a feedback loops. This insures a sampling variation, and provides self-control. A3 – Plant Operation and Validation Thru this stage the chemically challenged products are separated, condensed, transported and storage. The GREEN Trucks used by our company transport the large and bulky materials to our storage facilities. While the Energy Efficient Electric fork-lifts rise the material on the top level bins. The entire distribution system is monitored thru Noax Technologies industrial computers. When an older is received at the delivery gate, the operator of a fork-lift is immediately informed thru on board computer. The usage of GE Wave Technology enabled a seamless monitoring of our inventory floor. The system profits an organized older of storing, and chandelling the product, providing an effective logistics strategy. A4 – Seamless Production with GREEN While a lot of our services include logistics of chandelling chemical products, we are offering an innovative packaging line for bio-chemical, toxic, and pharmaceutical materials. Again, we are using GE Ready2Process technology which enables us to develop the most sophisticated packaging solutions, human safe, and environmentally GREEN. The process is monitored for QS9000 and ISO9000:2000 quality standards. That profits us with national-wide services, further world wide delivery. A separate testing facility does testing of samples of the designed packages. A5 – Logistics center and Final QA Test Feedback At the final stage we operate separate inventory facilities were we handle specially dangerous and toxic merchandise. Each product, bottle and box gets here its individual batch recording number. The company that provides us this technology is Rockwall Automations. We decided to co-operate with them since their machines can be interfaced with Noax inventory system. The facility here has also an individual air conditioning system from Rockwell, to keep our products safe and away from corrosion. Electrical transportation rollers from Rockwell are an addition to our GREEN organization. All the products that we transport thru our facility are being handled on a low power – high torque motor. There is completely no CO2 emission, and the solar umbrellas from GE mounted on the ruff provide a source of natural electrical energy to power this transportation belts. Again, from here our logistic operation GREEN trucks deliver national-wide. The back feed validation equipment again tests the timing, inventory correctness and packaging quality.
ISO TQM Principle 5 - Systems Approach to Management Resources and activities are managed as a process instead of individual tasks. Instead of using two identical resources for two different tasks, the tasks can be setup that one task begins after the other tasks ends. Instead of two separate resources, you use only one resource for both tasks. By evaluating process failure risks, consequences and impacts of activities on (internal, as well as external) customers, suppliers and other interested parties becomes possible, and measurable. This related to the CIMpgr process model and the PFRA model. The CIMpgr process model groups separate activates into a meaningful process. You know exactly when one process finishes and when another process begins. PFRA clearly shows which events are the most risky. Our company can uses the PFRA along with the CORA tool to determine which problems to tackle first or which customer requirements to solve. ISO TQM Principle 6 - Continual Improvement Use of control charts helps Pack-It-Solutions company to oversee where the products produced failed, with respect to undesired characteristics (control limits). Failure’s can be easily identified and the cause can be re-engineered and eliminated before any defective products would be made. This saves the company time, labor, money, and its resources. Control charts can also help the company better understand how the process / system/ or equipment behaves to different environmental factors. Our Process-related Failure Risk Analysis method belongs to the family of failure mode and effect analysis (FMEA) methods, and is part of our TQM and Six-Sigma approach. PFRA is a Team Oriented Problem Solving (TOPS) method, aimed at minimizing dissatisfaction, and financial loss for process related failure risks. These are the details of the procedure: The PFRA method focuses at seven key aspects:
2. Identify potential risks and failure modes and their effects: By applying the PFRA technique during the process, the team can locate all potential failures at the earliest possible stage.
4. Select and manage subsequent actions: In cases in which the risk of potential failures is high, an immediate control plan must be devised and actions need to be taken to control the situation. 5. Observe and learn: For each system or product/process design, PFRA / DFRA represent a dynamic, living knowledge-managed document that needs to be updated so that real data can be used to determine the risks. 6. Document the process: As well as store the PFRA / DFRA contained information in a widely accessible format for ease of access and use.
7. Enter the values into
the PFRA / DFRA spreadsheet on a relative scale:
This is determined by the local PFRA / DFRA Team, and are identified by
severity, detection, and occurrence. Rating = 2: A Very Slight Effect on the component of process, and/or on system performance. Over all customer satisfaction shouldn’t be effected. Rating = 3: A Slight Effect on performance, or process operation. The customer is slightly disappointed, but no vital fault will be noticed.
Rating = 5: A Moderate Effect on performance, or process operation. The customer is disappointed, and no vital fault will be noticed. Rating = 6: A Significant Effect on performance, or process operation. The customer is significantly disappointed, and a fault will be noticed that may cause part repair, or rework. Rating = 7: A Major Effect on performance, or process operation. The customer is severely affected, but system is safe and operable. Fault is obvious and will cause part replacement. Rating = 8: An Extreme Effect on performance, or process operation. The device fails to start, or operate. The customer is severely affected, system is not operable but is safe and the fault will be obvious Rating = 9: A Very Serious, Potentially Hazardous Effect on performance, or process operation. The customer is severely affected; system is not operable, potentially unsafe and the fault is obvious. Rating = 10: A Hazardous/ Dangerous Effect on performance, or process operation. The customer is severely affected; system is not operable and unsafe. The fault is obvious, not complying with government regulations, and is hazardous and or dangerous. This kind of rating strategies are implemented on an industry wide scale, which gives different teams an opportunity to compare data and conclude solutions with new, better ideas. In addition to the PFRA analysis, we have interconnected three other rating measurement tools. These rating rules are categorized in 3 segments: 1. Severity Severity is used to calculate RPN or Risk Priority number. When analyzing RPN, the highest value is analyzed first, trace the cause and then eliminate it. Once completed the same process should be applies to the medium and then the lower values 2. Detection 3. Occurrence A potential process failure mode is the manner in which a process operation may fail to meet its purpose expressed in terms of a component/ part/ object characteristics. The cause of a process failure mode is the process deficiency, often with roots to the lack of design for manufacturing/ assembly/ disassembly, lack of professional tools, clamps and fixtures, used during the execution of the process, lack of appropriate operator training, poor workplace conditions, and others, that result in the failure mode. The effects of a failure are the consequence of its failure mode that would be observed by the disassembly operator, or quality control personnel at the subsequent operation, or by a user, and/ or customer.
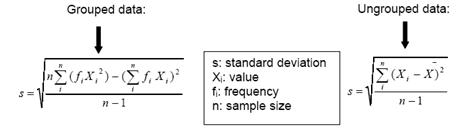
CLICK HERE TO SEE THE EXCEL FILE Control charts deal with characteristics that can be measured and assigned a numerical value. These values are plugged into equations that the control charts uses. Below is a list of mathematical data or formula used in control charts. Xi: value -The actual value of each measurement. fi: frequency -The frequency of each measurement - The number of times each measurement occurs in the sample. n: sample size - The sample size - the number of products measured or investigated. ∑: Sigma - the sum of all values taken. X bar -The average of a sample - is the sum of all values divided by the sample size. (formula given below) R - Range - the difference between the highest and the smallest value encountered in the sample. S - Standard Deviation - The standard deviation measures the variability in a sample data set. The higher the standard deviation, the larger the scatter about the average is.
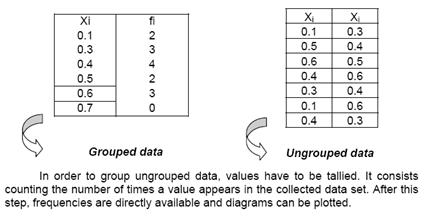
There are two different types of data that can be used in control charts. Grouped and ungrouped data Grouped data: In this case, data is classified by increasing order (Xi) and frequencies (fi) of occurrence next to their values. Ungrouped data: Data (Xi) is gathered in a bunch of values, without any classification. The table on the left represents ungrouped data as can be seen by the random values for X. The table on the right is that of grouped data as can be seen by the increasing values of X and by the frequency column.
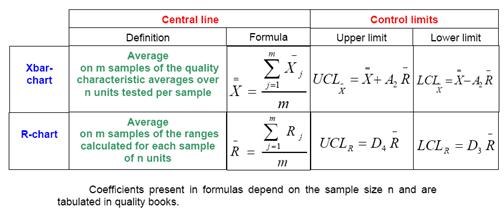
Many different types of control charts are available for use. Some control charts and their respective uses are listed below. For the context of this assignment however, we will be using X -Bar and R type control charts.
Formulas for X-Bar and R-Charts are given below. The coefficients A2, D3, and D4 in the formula below depend on the sample size and are usually found in mass media.
Steps in Constructing an R Chart: 1. Select k successive subgroups where k is at least 20, in which there are n measurements in each subgroup. Typically n is between 1 and 9. 3, 4, or 5 measurements per subgroup is quite common. 2. Find the range of each subgroup R(i) where R(i)=biggest value - smallest value for each subgroup i. 3. Find the centerline for the R chart, denoted by
4. Find the UCL and LCL with the following formulas: UCL= D(4)RBAR and LCL=D(3)RBAR Statistical Quality Control Applied: After collecting the required data and plotting it into the control charts, we output analysis that will oversee the future of our processing line. The first step is deriving the coefficients A2, D4 and D3. We simply fallow the table form the specification sheet.
Therefore:
We apply the collected data to construct the Control Chart:
Next we plotting the subgroup data and assuring that the process is in statistical control. In a case that the test is not successful, we need to eliminate the cause and repeat the testing procedure.
We never eliminate subgroups that have points out of the range.
Next step is the application of standard deviation that could be executed by applying the following formula:
Therefore we conclude that:
While we have identified the R-BAR, we need to find also the X-BAR. As noted from the methodologies applied, we used the following formulas:
While we assume A(2) to be at 1.023, we result the following findings after plotting in to a X-chart:
Therefore we conclude that:
ISO TQM Principle 7 - Factual Approach to Decision Making Decisions made by management will be based on information from these TQM tools. The tools provided in this course save time by grouping relative data into one table and by quickly calculating values that can provide answers, in case when a process in control, or a clients requirement is highly desired.
ISO TQM Principle 8 - Mutually Beneficial Supplier Relationships Pack-It-Solutions keep an excellent relation with the suppliers. By building a great relationship, we will be always prepared to respond to ever-changing economy and to customer’s satisfaction re-assurance. Pack-It-Solutions and our co-operating companies follow particular steps:
4. Summary This assignment reveals the potential improvements through updates to the subsequent TQM tools: CIMpgr Process Models, Component Oriented Requirements Analysis (CORA) matrix, and the Process Failure Risk Analysis (PFRA). Furthermore, a quality control audit was conducted in Pack-It-Solution Comp., to establish if the International Organization Standardization codes (ISO) 9001:2000 are being applied to the essential plant functions.
5. References and Bibliography "Paul G. Ranky, IE673 Total Quality Management, Fall 2008, e-Learning Pack ID # IE673-FALL2008-70-38" "Paul G. Ranky"
Ranky, P.G.: http://www.cimwareukandusa.com
| |||||||||||||||||||||||||||||||||||||||||||||||||||||||||||||||||||||||||||||||||||||||||||||||||||||||||||||||||||||||||||||||||||||||||||||||||||||||||||||||||||||||||||||||||||||||||||||||||||||||||||||||||||||||||||||||||||||||||||||||||||||||||||||||||||||||||||||||||||||||||||||||||||||||||||||||||||||||||||||||||||||||||||||||||||||||||||||||||||||||||||||||||||||||||||||||||||||||||||||||||||||||||||||||||||||||||||||||||||||||
|
Send mail to
kd52@njit.edu with
questions or comments about this web site.
|


